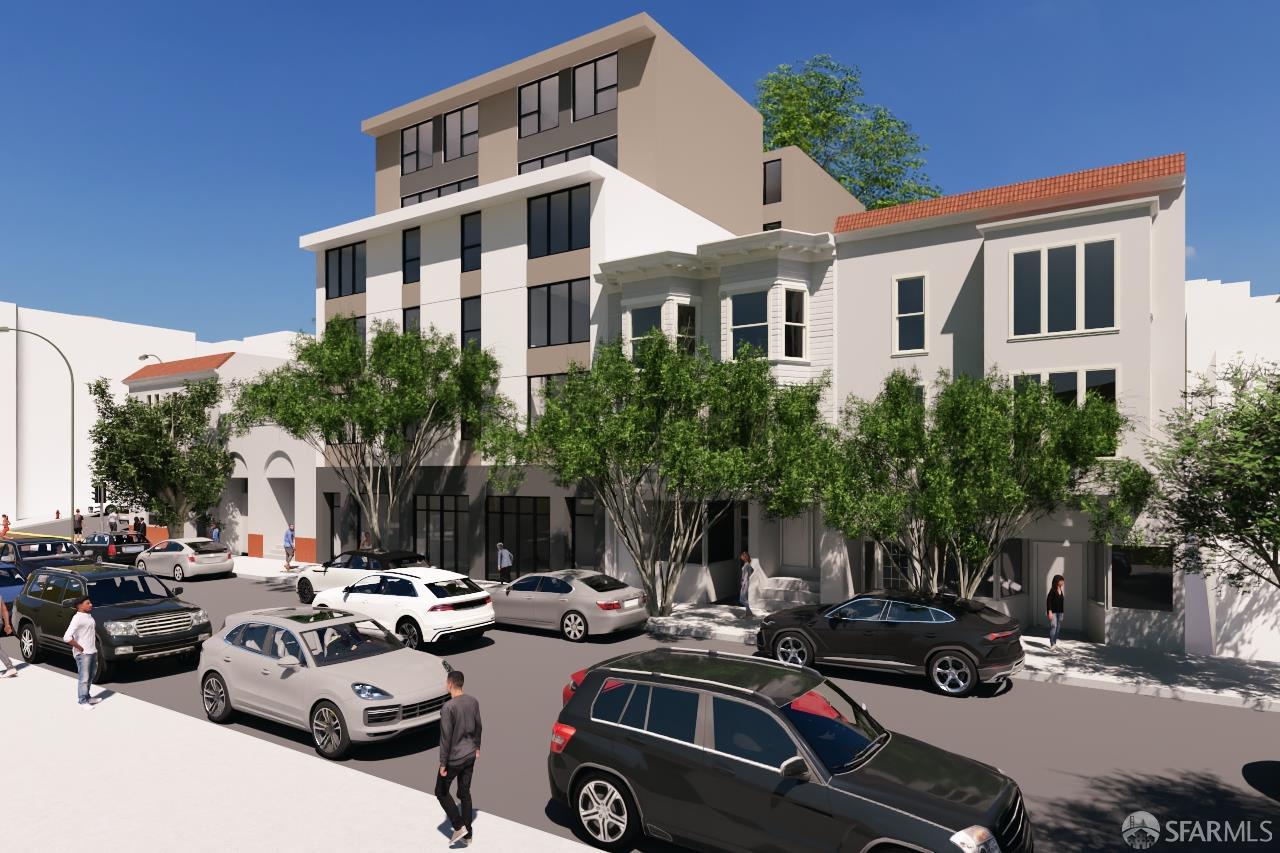
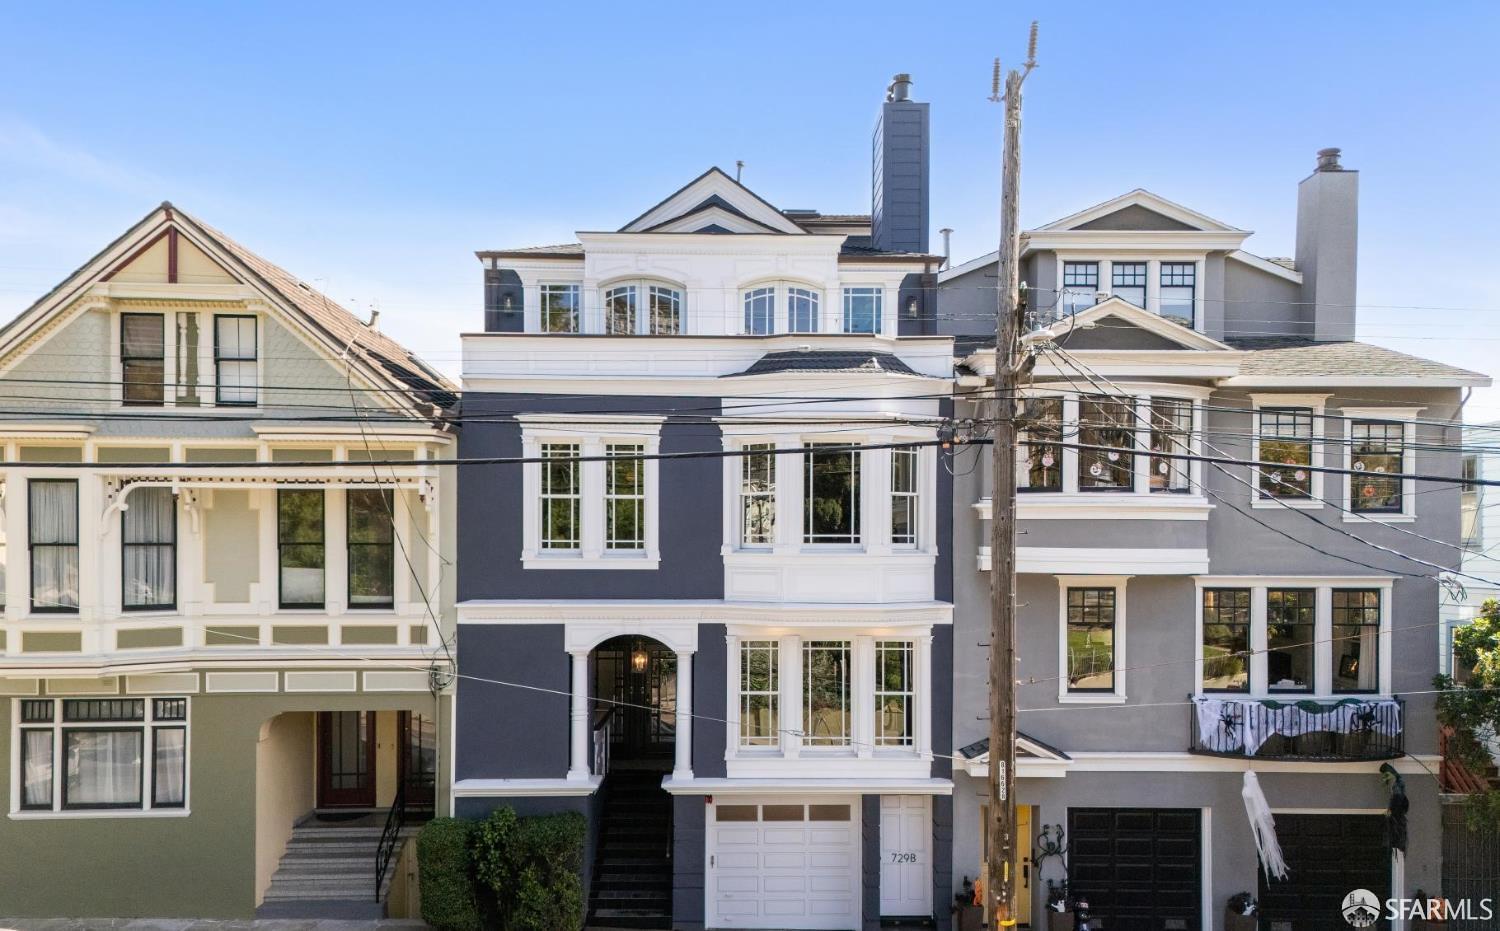
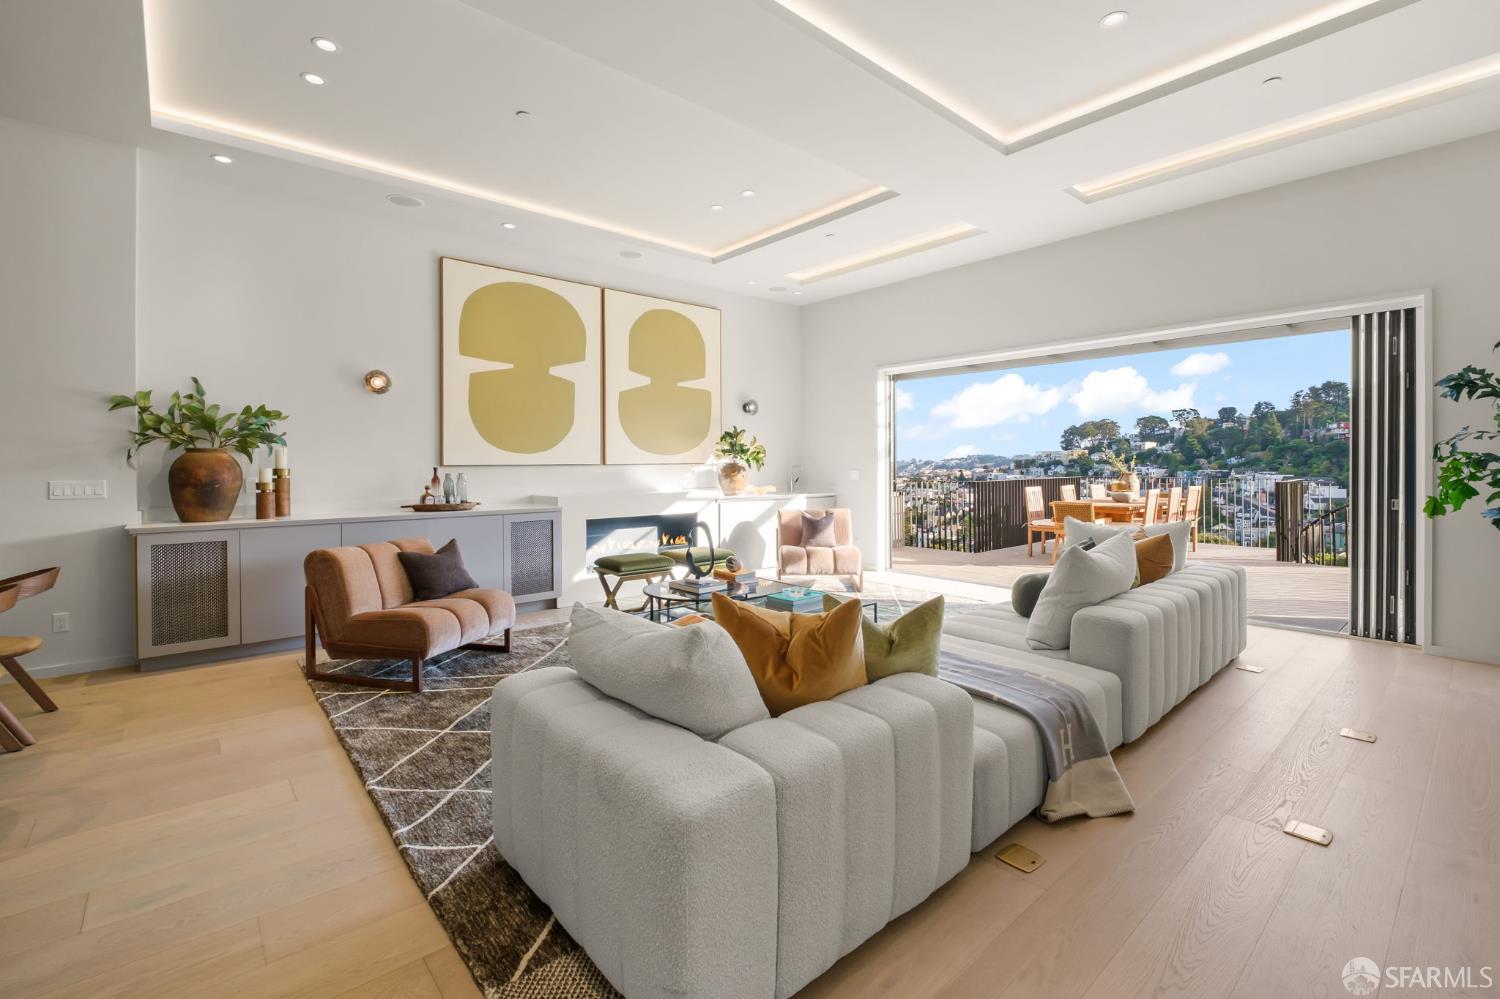
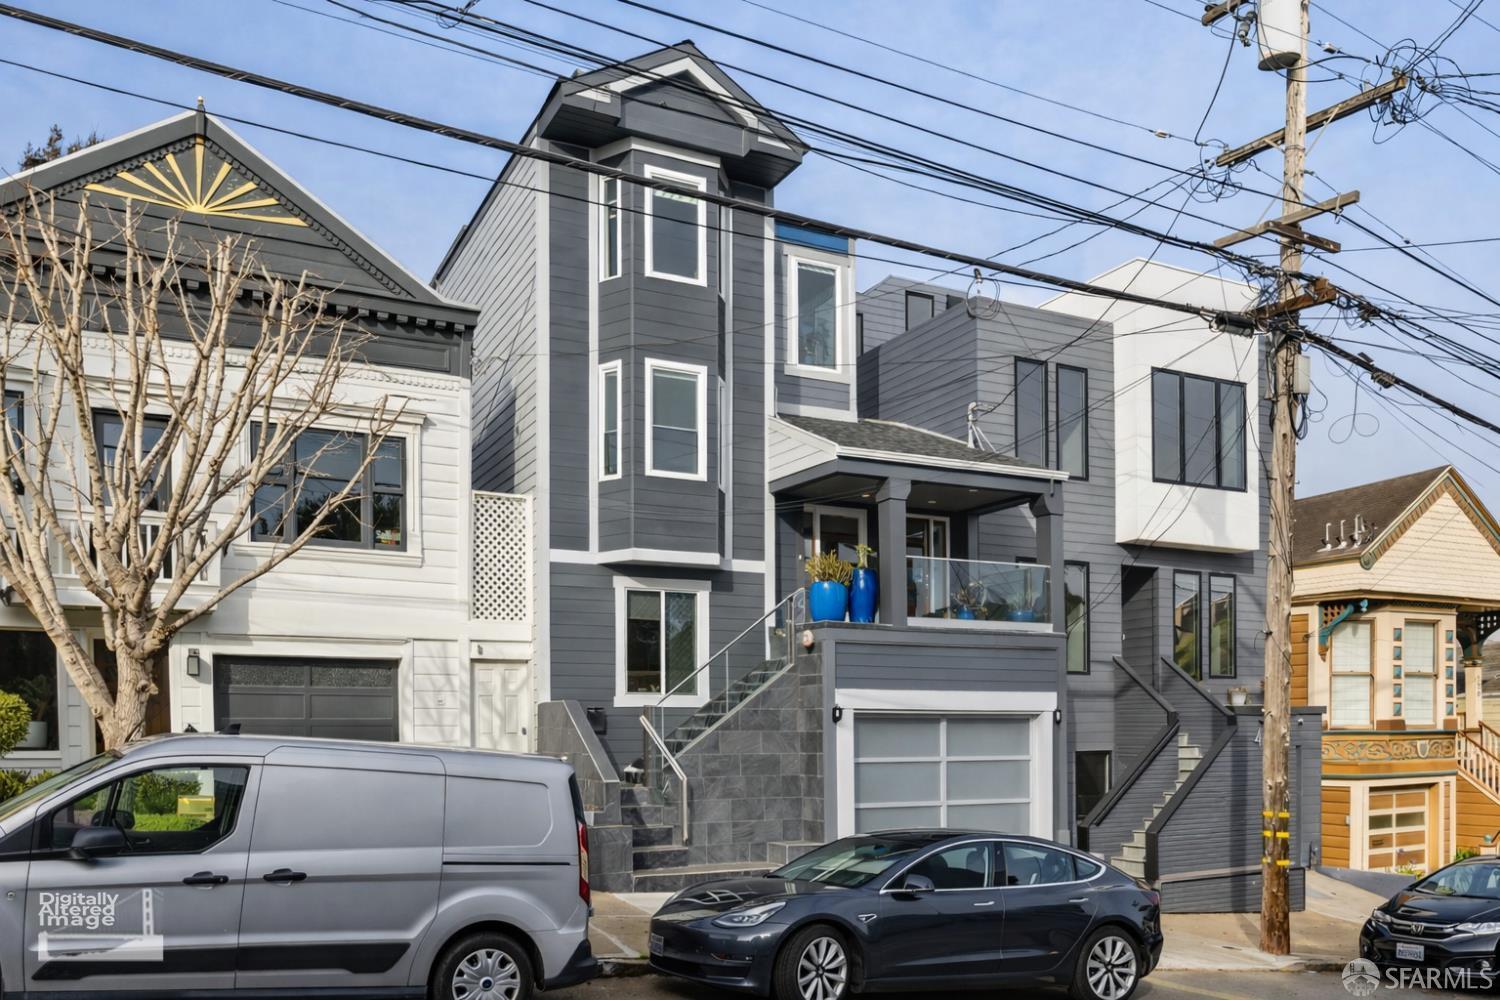
A neighborhood that feels remote, even though it's not.
It’s quiet here, which residents prefer but keeps the neighborhood more family friendly than young and hip — though it’s not far from the Mission, which comes to life in the evenings and is just a hilly walk home to slumbering Noe Valley.
What to expect: sunny and clean but not necessarily trendy, Noe Valley is chockablock full of parents with strollers and ice-cream toting youngsters.
What Noe Valley lacks in hip nightlife it makes up for in family-friendly fun in the park or along quaint 24th St. where kids in soccer cleats and neighbors gather on weekends and couples enjoy date nights at any one of the casual but intimate restaurants.
The lifestyle: casual and comfortable, Noe Valley is ardent about its slower pace of life.
Noe Valley is a proper village — complete with a butcher, a cheesemonger, a chocolate shop, a book shop and storefronts with even more panache, like farm-to-table cafes and boutiques — making weekends come alive with activity, all without the expected pretense.
Unexpected appeal: proximity to everything south of San Francisco
Though it’s close enough to downtown San Francisco to make the daily commute with ease, Noe Valley is also beautifully positioned to give you access to the freeways to transport you to Silicon Valley without too much hassle.
The market: prices are high, but it's an easy place to call home
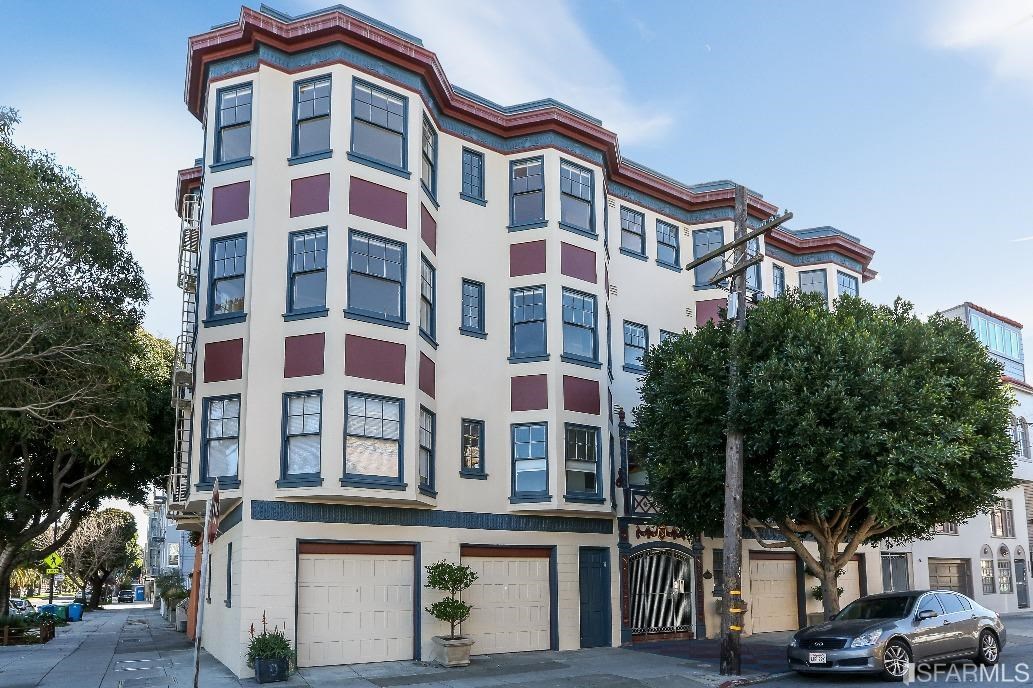
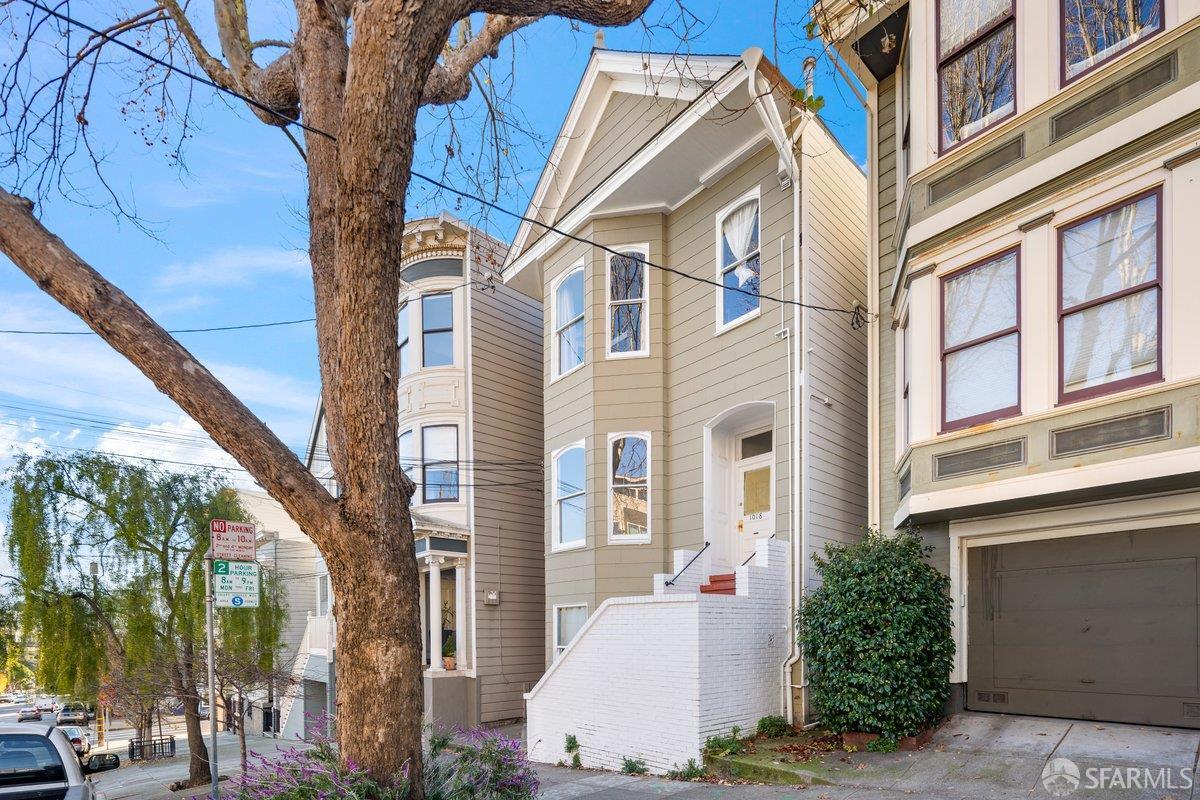
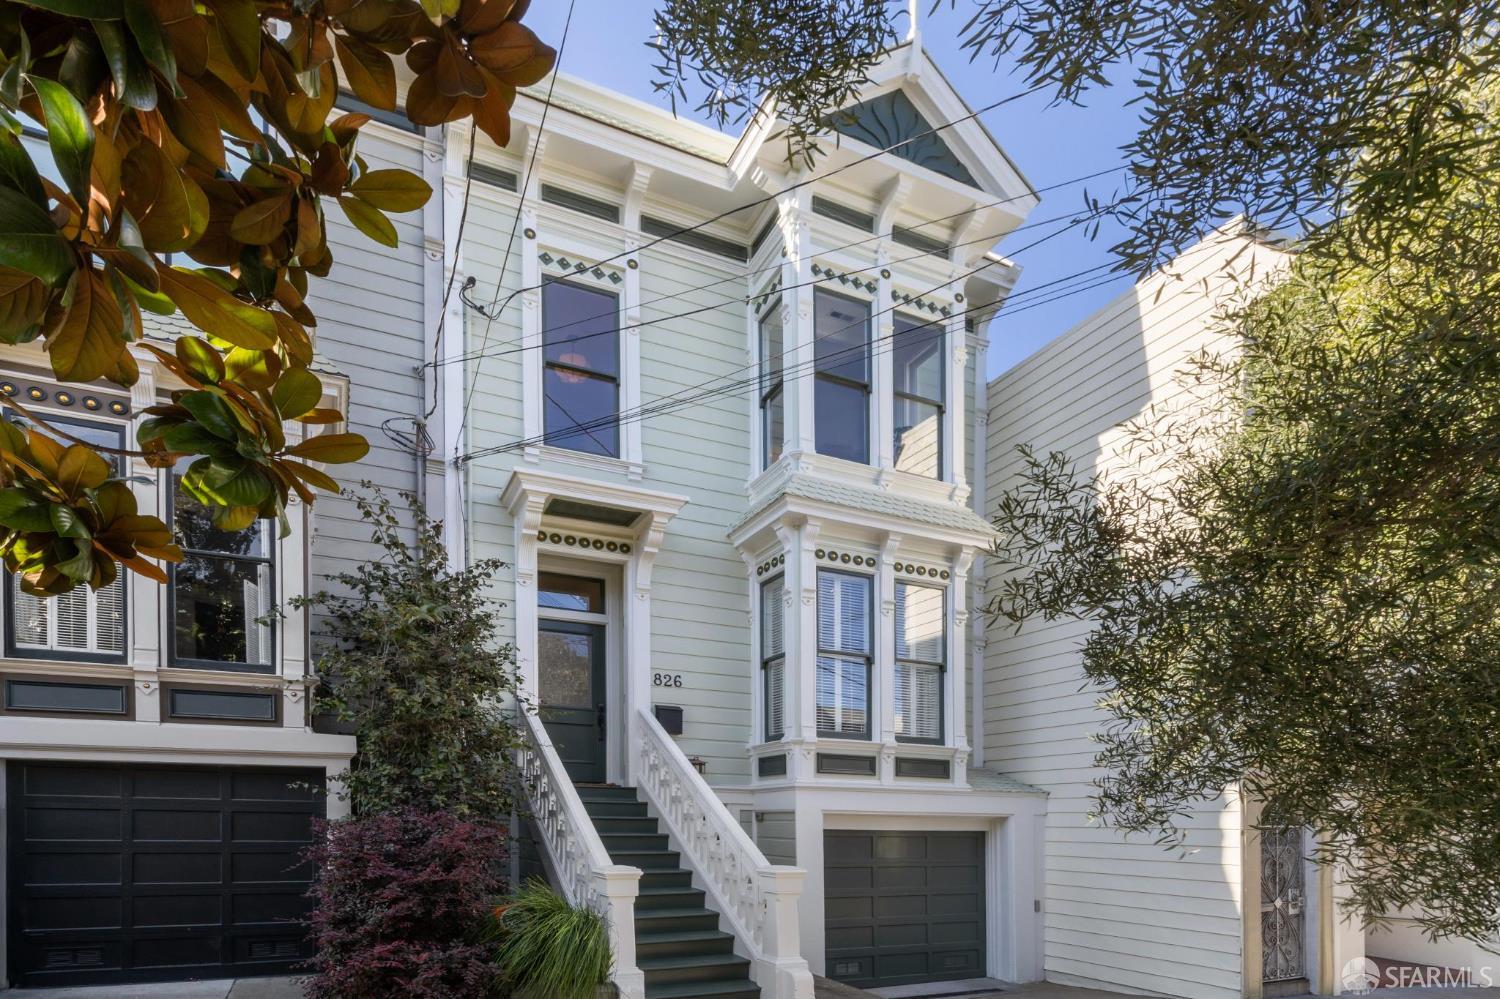
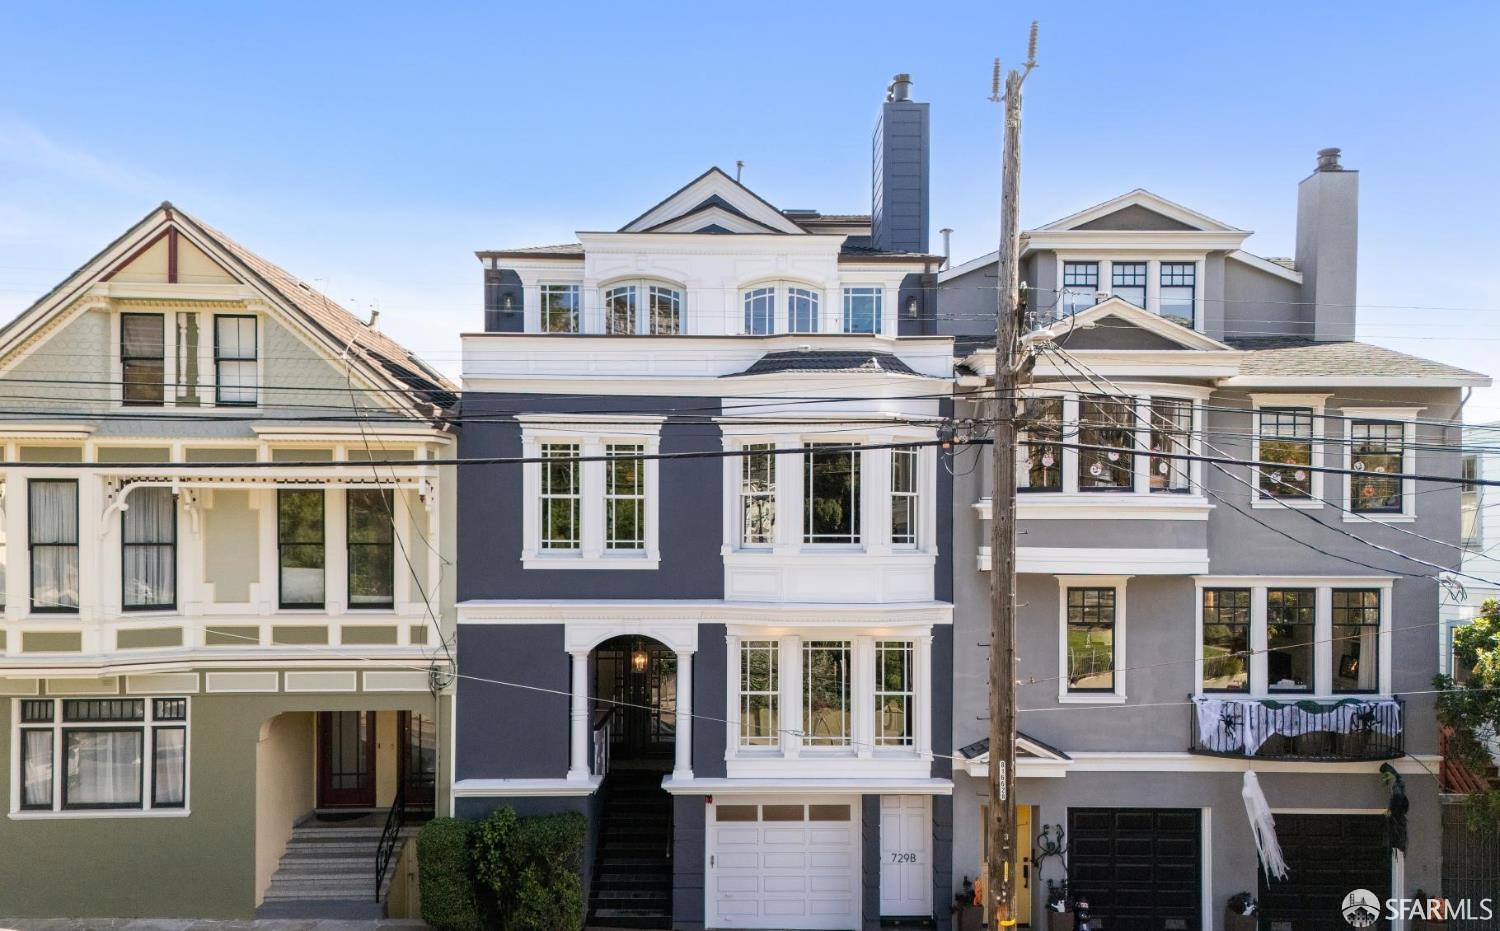
Median home prices are up around $1.9 million, which makes this a pricey neighborhood, though not the priciest in the Bay Area — and you have a choice of single-family homes, apartments in multi-unit buildings with shared backyards and more.
You'll fall in love with: safe, sleepy streets and spacious homes designed for longtime residency.
If sunshine and village life suit you but you want to be close enough to the action, Noe Valley is for you, with its adorable main strip that has an elevated small-town feel and sheer and deliberate peacefulness.


